


The Euro registers modest gains of 0.12% as traders remain optimistic about the outcome of US-Iran talks, which had been uninterrupted, as revealed by the Pakistani Foreign Minister to journalist Mallick. Recently released data favours the US exceptionalism narrative, which has rarely failed to underpin the US Dollar, perhaps due to softer-than-expected jobs data ahead of Friday’s Nonfarm Payroll figures.
Geopolitics leading the way, macro-data in the backseat
Market mood is mixed, though driven by US equity markets, with ebbs and flows exiting the tech sector, moving into other industries, with the Dow Jones poised to reach record highs. In the meantime, the Middle East war continues even though US President Trump brokered a ceasefire between Israel and Lebanon, which is very fragile as Israeli armed forces attacked the south of Lebanon. The proposal was rejected by the Iran-backed militia Hezbollah, while Israeli forces revealed that they wouldn’t withdraw from the country.
US data weighs on the US Dollar, despite Fed’s Schmid comments
Earlier, jobs data revealed a moderate slowdown, as the number of Americans filing for unemployment benefits exceeded estimates of 213K, coming in at 225K for the week ending May 30. At the same time, the US Challenger Job Cuts rose from 83.837K to 97K in May, a 16% rise from April. The looming Nonfarm Payroll (NFP) figures on Friday and falling Oil prices drove the Greenback lower. The US Dollar Index (DXY), which tracks the buck’s performance against six currencies, is down 0.13% at 99.42.
The Kansas City Fed’s Jeffrey Schmid said that “inflation is too high”, adding that it’s the biggest risk facing the US economy and that the question is “whether the Fed should stay patient on rates,” or act.
Europe faces a stagflation scenario and a hawkish ECB
In Europe, the story is different, as most economic data has pointed downwards: the Citigroup Economic Surprise Index (CESI) for the Eurozone dropped to -45.2 as of June 3, signaling that economic indicators are underperforming or missing estimates, suggesting some weakness within the European Union (EU). The EU’s economy grew 0.1% QoQ in Q1 2026, below the 0.2% and 0.3% growth in Q4 2025 and Q3 2025, respectively, hinting at an ongoing slowdown amid rising prices — with the HICP hitting 3.2% YoY — spurred by the energy shock linked to Iran’s war.
Nevertheless, European Central Bank (ECB) policymakers remained vocal about their intentions to raise rates amid sticky inflation driven by energy supply disruptions. ECB’s Wunsch, Simkus—twice—, Stournaras, Schnabel, Nagel, amongst others, explicitly support a June rate hike at next week’s monetary policy meeting.
What’s ahead in the calendar?
In the US, Nonfarm Payrolls figures are expected to show some deceleration in May, from 115K to 85K, as foreseen by the median and the Unemployment Rate is expected to hold at 4.3%, unchanged. In Europe, Gross Domestic Product (GDP) figures for the first quarter of 2026 are expected to be unchanged, estimated at 0.1% QoQ and 0.8% YoY, compared to previous prints.
EUR/USD Technical Levels
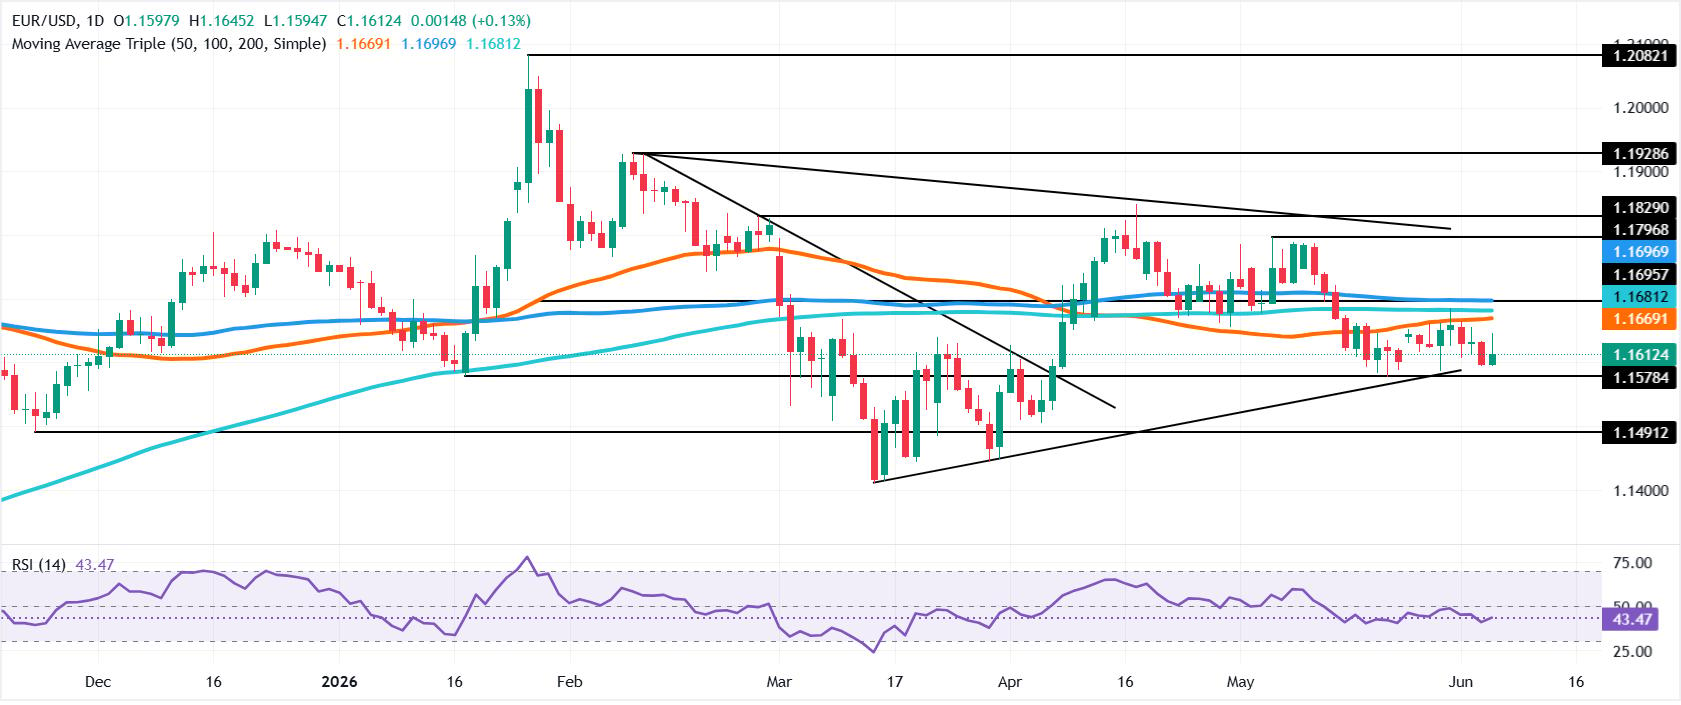
The EUR/USD continues to trade sideways, capped on the upside by key Simple Moving Averages (SMAs), with the 20-day SMA providing first resistance at 1.1645, followed by the 50-day SMA at 1.1670 and the long-term trend-setter, the 200-day SMA at 1.1679. If those levels are surpassed, look for a test of the 100-day SMA at 1.1696 ahead of the 1.1700 mark.
Downwards—the path of least resistance, the first support is the May 21 daily low at 1.1576. Below this area, and the next area of interest would be the April 6 low of 1.1505, ahead of the March 30 swing low of 1.1443.
Euro Price Today
The table below shows the percentage change of Euro (EUR) against listed major currencies today. Euro was the strongest against the Canadian Dollar.
| USD | EUR | GBP | JPY | CAD | AUD | NZD | CHF | |
|---|---|---|---|---|---|---|---|---|
| USD | -0.13% | -0.08% | -0.05% | 0.10% | -0.06% | -0.11% | -0.34% | |
| EUR | 0.13% | 0.05% | 0.09% | 0.24% | 0.06% | -0.06% | -0.22% | |
| GBP | 0.08% | -0.05% | 0.04% | 0.19% | 0.01% | -0.06% | -0.27% | |
| JPY | 0.05% | -0.09% | -0.04% | 0.14% | -0.03% | -0.12% | -0.32% | |
| CAD | -0.10% | -0.24% | -0.19% | -0.14% | -0.18% | -0.27% | -0.45% | |
| AUD | 0.06% | -0.06% | -0.01% | 0.03% | 0.18% | -0.06% | -0.25% | |
| NZD | 0.11% | 0.06% | 0.06% | 0.12% | 0.27% | 0.06% | -0.21% | |
| CHF | 0.34% | 0.22% | 0.27% | 0.32% | 0.45% | 0.25% | 0.21% |
The heat map shows percentage changes of major currencies against each other. The base currency is picked from the left column, while the quote currency is picked from the top row. For example, if you pick the Euro from the left column and move along the horizontal line to the US Dollar, the percentage change displayed in the box will represent EUR (base)/USD (quote).
Read the full article here


