West Texas Intermediate (WTI) US Oil drops 2.55% on Tuesday, trading around $59.80 at the time of writing. Crude Oil prices come under pressure after reports that the Organization of the Petroleum Exporting Countries and its allies (OPEC+) plan to increase production starting in December.
According to sources cited by Reuters and Bloomberg, the cartel is set to raise its output target by 137000 barrels per day (bpd), bringing total production close to 1.66 million bpd. While the move signals confidence in market stability, it also raises concerns about a potential oversupply that could weigh on prices in the near term.
Meanwhile, the United States (US)announced last week sweeping sanctions against Russia’s two largest Oil producers, Rosneft and Lukoil, freezing their assets and banning transactions with US entities. Société Générale described the measures as “Washington’s most aggressive strategy yet against Russia’s energy sector,” adding that the move could eventually tighten global supply and support Oil prices.
On the geopolitical front, optimism surrounding US-China trade talks offers some support. US Treasury Secretary Scott Bessent said that a deal was close, including the removal of planned 100% tariffs on Chinese imports, as US President Donald Trump is scheduled to meet his Chinese counterpart Xi Jinping on Thursday at an Asian summit, a meeting closely watched by Oil markets.
Traders also await the weekly Crude Oil stock report from the American Petroleum Institute (API), due later in the day. A larger-than-expected build in inventories could increase downward pressure on WTI in the coming days.
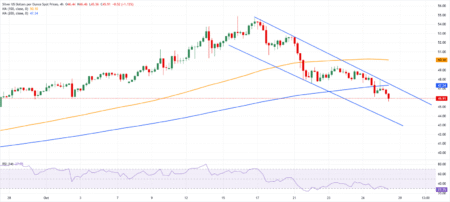
WTI Technical Analysis: Finds support near $59.50, but downside risks persist
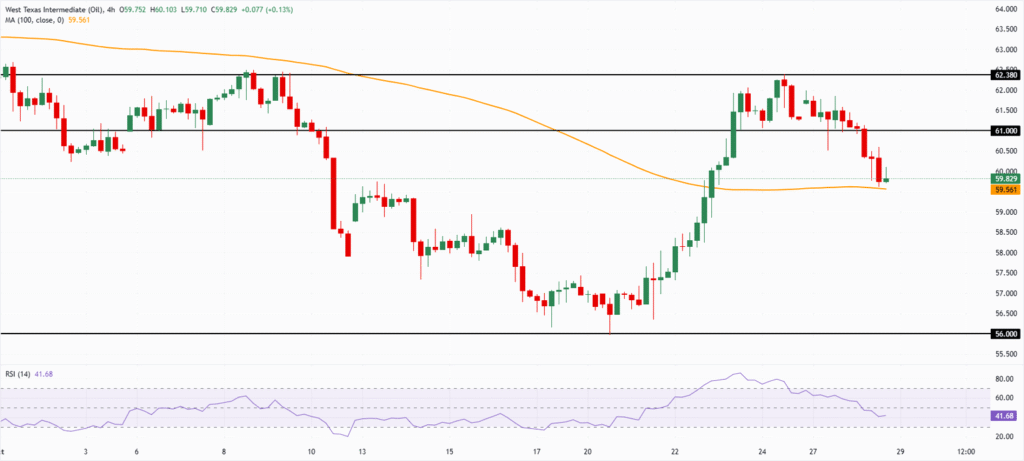
WTI US Oil 4-hour chart. Source: FXStreet.
WTI extended its decline below $61.00 but has found some support near the 100-period Simple Moving Average (SMA) on the 4-hour chart, currently at $59.56. A clear break below this level could signal renewed bearish momentum, opening the door for a deeper drop toward the October 20 low at $55.98.
On the upside, initial resistance is seen around the psychological $61.00 level, followed by the October 24 high at $62.38.
The Relative Strength Index (RSI) on the 4-hour chart has slipped below 50 while remaining above 30, indicating that downside potential persists in the short term.
Read the full article here


