Q4 Earnings Update
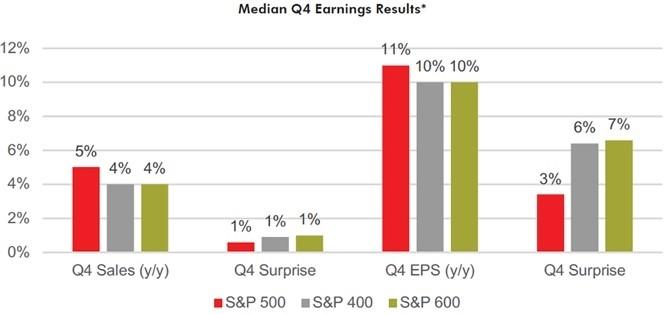
The majority of the fourth quarter 2024 earnings season is now behind us with about three-fourths of large-cap, two-thirds of mid-cap, and half of small-cap companies having reported. So far, while the stock market has seen some volatility with certain individual stocks, the overall reporting period has been relatively standard. As shown on Figure 1 below, revenues grew by mid-single digits and earnings grew by double digits for the companies that are profitable and have reported. This was a bit better than expectations entering earnings season, but not necessarily an outsized beat.
Figure 1: Median Q4 Results
Figure 2 charts the earnings surprise for the quarterly results. Overall, 75% of the large-cap S&P 500 exceeded consensus earnings estimates followed by 75% of the mid-cap S&P 400 and 66% of the small-cap S&P 600. These percentages are in-line with the last several quarters and do not mark a major deviation from trend.
Figure 2: Proportion of Stocks with Positive Sales/EPS Surprises
Looking forward to 2025, the table below shows the expectations across the three capitalization groups. A slight majority of each group has seen downward earnings revisions most recently, as has the whole, albeit very slightly. This is common at the beginning of a calendar year as companies tend to start with conservative guidance, ahead of optimistic analyst estimates. However, it is still notable given the high P/E valuation the U.S. stock market currently has at roughly 25x 2025 estimates. Clearly, investors expect solid earnings growth from the market in 2025.
In terms of the reactions to the results of the quarter, they have been mixed. Within the S&P 500 (47%), S&P 400 (48%), and S&P 600 (48%), just under half of the stocks have traded up since reporting their results. While not impressive, the figure is not so poor as to be out of the ordinary for earnings season. Unsurprisingly, the median result for stocks reporting a positive earnings surprise was a gain of 5% in their stock price and the median result for stocks reporting an earnings disappointment was a 5% decline in price. These percentage moves are also within the norm for recent reporting periods.
Figure 3: Distribution of Earnings Reactions
- Reactions of at least +20% include large-caps NFLX, TMUS, PLTR, and IBKR; mid-caps DOCS, LSCC, MAT, CROX, FLG, and ESE; and small-caps OSIS, NSP, VIAV, PBI, DNOW, and CRSR.
- Reactions of at least -20% include large-caps DECK, STZ, WST, MANH, NBIX, and SWKS; mid-caps TTEK, CACI, FLR, BILL, WHR, FMC, and BOOT; and small-caps BL, NWL, PII, AGYS, NEOG, HBI, PINC, MXL, and APOG.
Across the three universes, the table below details how positive versus negative reactions stack up in terms of current and forward growth. Not surprisingly, those with stronger EPS and EPS beats reported in Q4, and without downward revisions to 2025 EPS estimates, reacted more positively.
Lastly, below is a tight screen based on actual earnings results. This screen includes stocks from all three S&P universes which have the following criteria: positive earnings reaction, >=5% Q4 sales and 10% Q4 EPS growth, a positive surprise on both Q4 sales/EPS, >=5% 2025 sales and 10% 2025 EPS estimates, and a positive 2025 EPS revision over past 60 days. Of over 860 stocks that have reported, there are only 32 that meet this stringent criteria. Standout industry groups include Aerospace/Defense, Building-Mobile/Manufacturing & RV, Leisure-Related, Regional Banks, Investment Banks/Brokers, Software, Contract Manufacturing, and Airlines. For growth investors, this screen is a good starting point to find companies with positive technical and fundamental momentum.
The next screen are stocks that meet the strict growth metrics and estimate criteria in the previous screen, but had a negative reaction initially to earnings results. These could be candidates to buy if/once they eventually stabilize and begin to retake key technical levels.
Conversely, the screen below includes some of the negative reactions with weak fundamentals to match. These are stocks where we expect weak short-term performance. All these stocks had < 3% Q4 sales growth and 5% EPS growth, misses on both versus consensus, <3% 2025 sales and 5% EPS growth estimates, and a negative 2025 EPS revision over 60 days. Of note, only 14 stocks met these criteria.
Kenley Scott, Director, Global Sector Strategist at William O’Neil + Company, an affiliate of O’Neil Global Advisors, made significant contributions to the data compilation, analysis, and writing for this article.
The William O’Neil + Co. Research Analysts made significant contributions to the data compilation, analysis, and writing for this article.
Disclaimer
No part of the authors’ compensation was, is, or will be directly or indirectly related to the specific recommendations or views expressed herein. William O’Neil + Co., its affiliates, and/or their respective officers, directors, or employees may have interests, or long or short positions, and may at any time make purchases or sales as a principal or agent of the securities referred to herein.
William O’Neil + Co. Incorporated is an SEC Registered Investment Adviser. Employees of William O’Neil + Company and its affiliates may now or in the future have positions in securities mentioned in this communication. Our content should not be relied upon as the sole factor in determining whether to buy, sell, or hold a stock. For important information about reports, our business, and legal notices please go to www.williamoneil.com/legal.
©2025, William O’Neil + Company, Inc. All Rights Reserved.
Read the full article here


