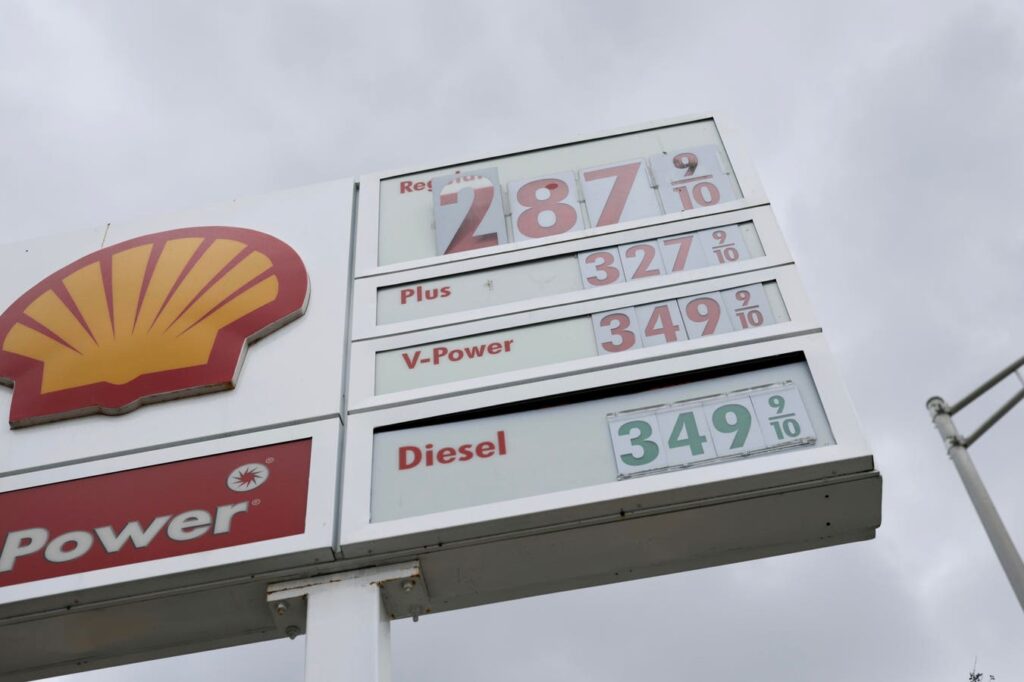
President Donald Trump has been announcing that gas prices are way down — or, as CNN put it, his “imaginary gas price has fallen.” He reportedly has said that “three states” had seen gas prices drop to $1.98 a gallon.
That’s not even close to being true, but there are deeper questions. Gas prices are down year over year and up from the beginning of the year. One’s a normal seasonal change. The other, even though it’s good for consumers, it’s a likely bad sign for the economy.
Where Gas Prices Sit
According to AAA’s gas price monitor, there is no state, plus the District of Columbia, where the average gas price is $1.98 a gallon, even for regular. The lowest per-gallon price as of May 4, 2025, was $2.655. That was in Mississippi. The next seven states were between $2.713 and $2.787. The next six states were between $2.838 and $2.892. The next nine, between $2.923 and $2.995. Nine more were between $3.004 and $3.099, then six between $3.101 and $3.197. Five between $3.202 and $3.293. Then two at $3.291 and $3.293; one at $3.603; two at $3.802 and $3.897; and, finally, three at $4.258, $4.495, and $4.775.
Mid-grade, premium, and diesel were all higher.
To show these in historical context, here is a graph of weekly U.S. average gas prices from August 20, 1990, to April 28, 2025, from the Federal Reserve Bank of St. Louis Federal Economic Data site.
This graph can be misleading. Gas prices have climbed a lot in nominal terms, meaning without any adjustment for inflation, so on the surface, it seems that gas is generally much more expensive than it ever has been in the past. However, by dividing gas prices by the Consumer Price Index for energy, the result gives a more accurate comparison in constant dollars. Here’s the FRED graph with that modification.
Of course, gas prices are important to millions. It can be a significant expense, and median household income has sharply trailed inflation for the last 25 years. Even if current national prices are relatively low compared to history, they are still a burden for many.
What The Monthly And Annual Gas-Price Changes Mean
There are multiple ways to look at price changes. Two useful ones in this case are what changes have happened recently, and how things stand year-over-year.
The most recent changes were upward from $3.018 in December 2024 to $3.121 in February. Then prices went down to March and have since grown to the average $3.165. In May 2024, the price was $3.603, so Trump was correct in that there has been a year-over-year drop, although, again, nowhere near as low as he had claimed.
The recent climb in price is normal for two specific reasons. One is that people drive more moving into summer, and with more demand, prices rise. The other part is that the formulations for gas change in spring and summer. More additives are required by government regulations to avoid increased smog and emissions as the site GasBuddy explains. The formulation changes alone can add up to 15 cents a gallon, while increased demand adds between five cents and 15 cents per gallon.
Not so regular is the year-over-year fall. This isn’t cyclical but more likely an economic response. Markets determine prices, largely through the expectations of investors and buyers who are making bets about the future of the economy and how much demand there will be for energy. The more pessimistic the view, the less predicted demand and, so, the lower the prices.
That is the bad news about longer-term falling gas prices. It’s another sign that the economy is facing trouble.
Read the full article here


