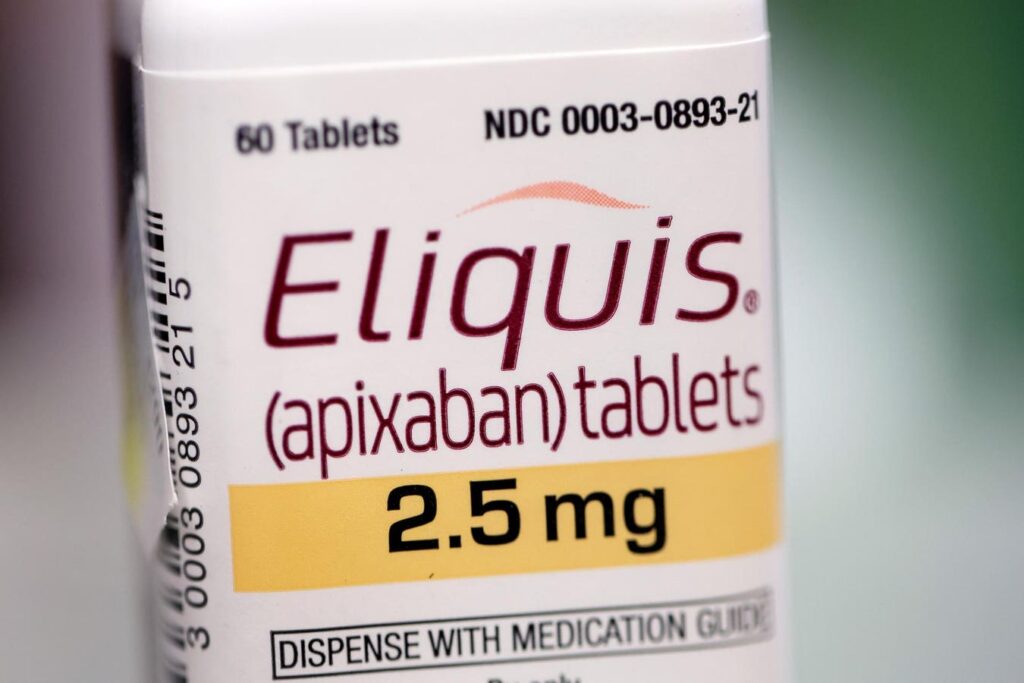
Bristol Myers Squibb is scheduled to release its earnings report on Thursday, April 24, 2025. Examining its historical performance, the BMY stock has tended to react negatively after earnings announcements. Over the past five years, it posted a negative one-day return in 55% of cases, with a median drop of 3.0% and a maximum decline of 8.5%.
Event-driven traders can leverage these historical patterns to gain an edge, though actual market reactions will depend on how results align with consensus estimates and market expectations. Two primary strategies emerge: first, evaluating the probability of a negative reaction and positioning ahead of the earnings announcement; second, examining the relationship between short-term and medium-term returns post-earnings to guide trading decisions.
Consensus forecasts call for earnings per share of $1.51 on revenue of $10.73 billion, compared with a loss per share of $4.40 on $11.87 billion in sales in the same period last year. Among the growth drivers, Bristol Myers Squibb’s portfolio — including Reblozyl, Opdualag, Breyanzi, and Camzyos — is expected to deliver solid performance, while the legacy divisions will likely weigh on sales as Revlimid and Sprycel revenues continue to decline.
If you prefer upside with lower volatility than individual stocks, the Trefis High-Quality portfolio offers an alternative, having outpaced the S&P 500 with returns exceeding 91% since inception.
See the earnings reaction history for all stocks
Bristol-Myers Squibb’s Historical Odds Of Positive Post-Earnings Return
Here are some observations on one-day (1D) post-earnings returns:
- Over the past five years, there have been 20 earnings instances, of which 9 yielded positive one-day returns and 11 were negative — roughly 45% positive outcomes.
- Focusing on the most recent three years, the positive rate rises to 55%.
- The median positive return was 2.2%, and the median negative return was -3.0%.
Additional statistics on 5-day (5D) and 21-day (21D) post-earnings returns are summarized in the table below.
Correlation Between 1D, 5D, and 21D Historical Returns
A lower-risk approach involves analyzing the correlation between short-term and medium-term post-earnings returns. For example, if 1D and 5D returns show the strongest correlation, traders might go long for five days following a positive one-day return. Below is correlation data based on five-year and three-year histories, where 1D_5D denotes the correlation between one-day and five-day returns.
Is There Any Correlation With Peer Earnings?
Peer earnings can sometimes influence stock reactions, with pricing effects starting prior to the announcement. Below is data comparing Bristol-Myers Squibb’s one-day post-earnings returns with those of peers that reported immediately before, for a fair comparison.
Now, investing in a single stock can be risky. On the other hand, the Trefis High Quality (HQ) Portfolio, with a collection of 30 stocks, has a track record of comfortably outperforming the S&P 500 over the last 4-year period. Why is that? As a group, HQ Portfolio stocks provided better returns with less risk versus the benchmark index; less of a roller-coaster ride as evident in HQ Portfolio performance metrics.
Invest with Trefis
Market Beating Portfolios | Rules-Based Wealth
Read the full article here


