seksan Mongkhonkhamsao/Getty Images
An options chain is a valuable tool that helps options traders make quick decisions and displays a range of relevant information at one glance. If you’re trading options, you’ll need to know your way around the options chain and how to use it to quickly gain the information you need.
Here’s what an option chain is, how it works and how to use it to help with options trading.
What is an options chain?
An options chain provides a range of summary information about a specific option expiration in a table, allowing the trader to quickly glance at vital data about these options. The data shown in a given options chain can vary — there’s no set standard for what must be there — and traders can see relevant information about how the option is trading, including its latest pricing.
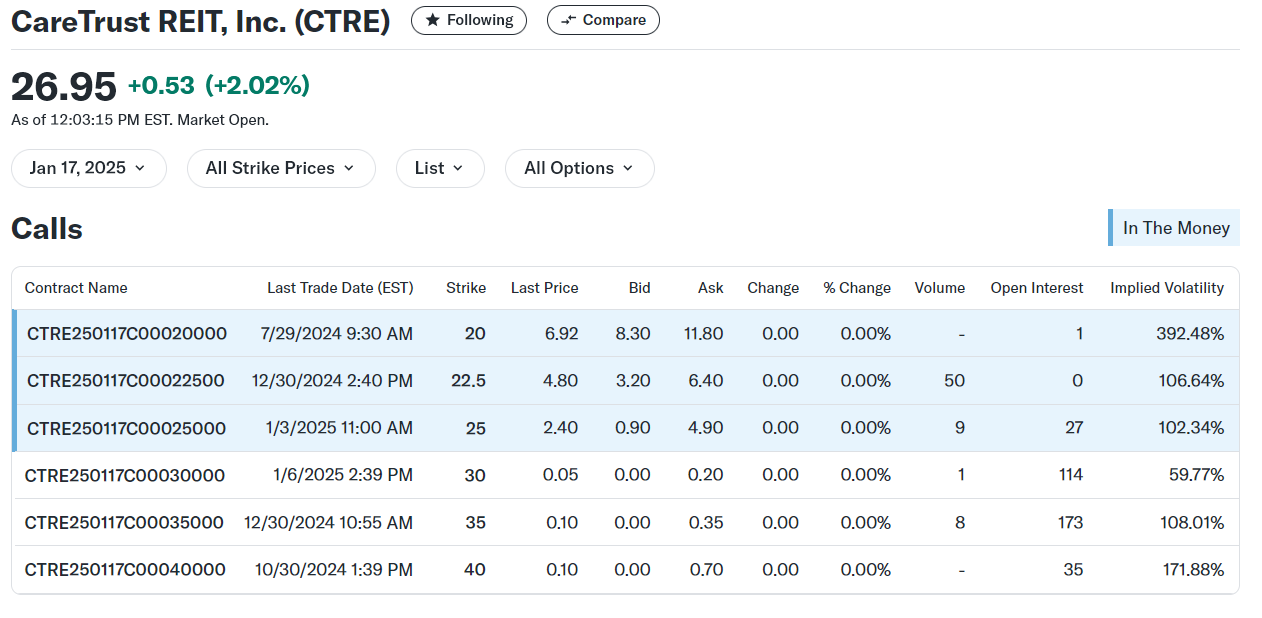
For example, the options chain below on CareTrust REIT comes from Yahoo Finance, and it offers a standard array of the data available on a chain. Each option expiration has its own chain. This part of the chain shows data for just the call options, and data for put options appears lower.

Source: Yahoo Finance.
As you can see in the graphic, this is only the data for the Jan. 17 expiration. If you wanted to check out the next month’s expirations, you could use the dropdown menu to select that data.
The best brokers for options trading may offer a wider selection of data in their chain, including option Greeks such as delta. These options Greeks can help you make sense of how an option price may move in the future.
Let’s run through the elements in the option chain above to see all the information available.
What does an options chain show?
Each stock that has options has a specific option chain devoted to it alone, so you’ll need to look up that stock’s chain to see information relevant to it. A typical option chain offers the following information:
- Contract name: This is the official code for the specific option, including its ticker symbol, expiration date, option type and strike price.
- Last trade date: This tells you when this specific option last traded. Sometimes an option may not trade for weeks or months.
- Strike price: The strike price shows where the option goes in the money.
- Last price: This shows what this specific option last sold for.
- Bid: The bid is the current price that a buyer is willing to pay.
- Ask: The ask is the current price that a seller is asking for the option.
- Change (absolute and percentage): These columns reveal the absolute change in the contract, as well as the percentage change.
- Volume: This column shows you how many of this specific option traded today. It starts again at 0 on each trading day.
- Open interest: This column shows you how many of each contract remains outstanding (“open”) and hasn’t been closed by an offsetting trade.
- Implied volatility: This column shows the volatility expected from the stock, given the price of the option. Here’s more on how implied volatility works.
The table above also helpfully shows which options are “in the money” by color-coding those rows in a light blue. Other options are “out of the money.”
Options chains typically allow traders to adjust the table in a few different ways. For example, a viewer can change how many strike prices are shown to focus on the most relevant. Stocks with a huge number of strikes could be literally dozens of rows long, and paring that down can make it easier to find info. Traders can also change the chain so that it shows calls and puts side by side, making it easier to set up more advanced trades that use both types of options.
Why is an options chain valuable to traders?
An options chain offers easy-to-access data about a stock’s available options, providing traders a quick way to find relevant information. A chain is valuable because:
- It provides a way to check which strikes are available: A chain quickly tells traders which strike prices are available for a given stock. While the strikes near the money are the most popular, many stocks have strikes that are far from the stock’s current price.
- It offers a way to scan prices: Finding recent prices is one of the most valuable functions of the options chain, and the table format allows readers to run down prices at various strikes to quickly find the premium they find attractive for the risk they’re running.
- It tells you how popular a strike is: With information such as volume and open interest, the chain also shows what other traders find interesting and are trading.
- It shows you how fresh the data is: Don’t overlook the date of the last trade, which tells you how fresh the latest price quote is. Prices that are more than even a few hours out of date should not be relied on. Plus, pricing data on publicly available option chains may not be updated in real time, unlike pricing data on a broker’s website.
- It shows multiple expirations: The options chain can also be adjusted to show expirations over time, allowing you to scan price data for months out and compare it.
Unlike stock quotes, which effectively show only one piece of pricing information, an options chain may provide dozens, if not hundreds, of option prices, in addition to a range of other valuable trading information.
Bottom line
An options chain provides a wealth of relevant options information to traders in a concise table, allowing them to quickly access the data they need to make an informed trading decision. Of course, it’s important to know that the data you’re looking at may not always be the freshest.
Read the full article here


