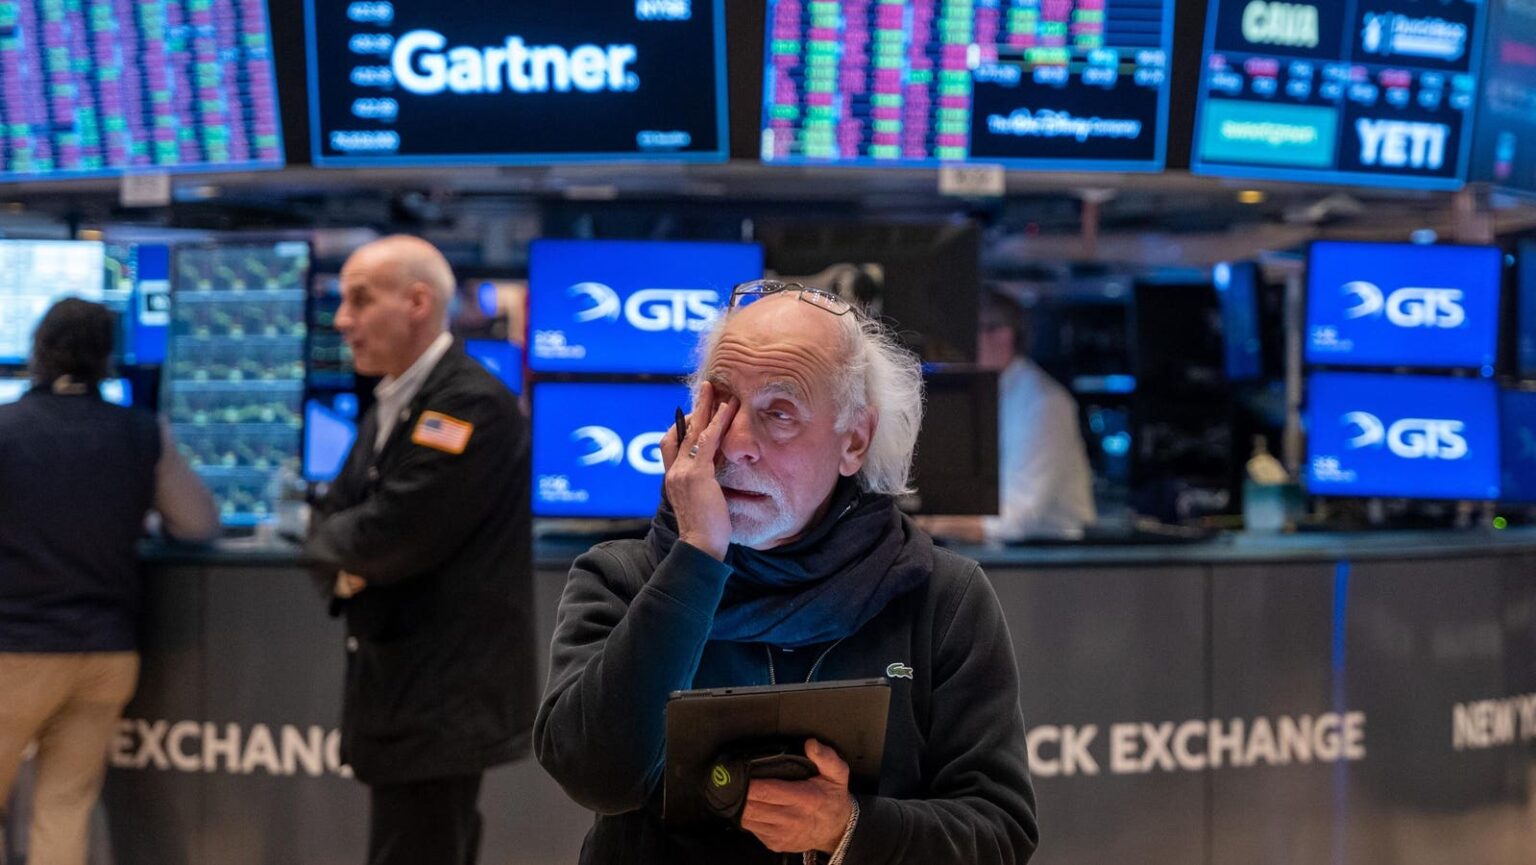
As we all know the markets took a beating last week, driven by President Trump’s tariffs announcement and retaliation by China. The S&P 500 fell by 10.5%, the Nasdaq by 11.4% and the Dow by 8.1% over two days.
From Michael O’Rourke at Jones Trading (no relation), “The S&P 500 sell-off Thursday and Friday is among the worst two-day declines for the benchmark index in history. The move is only surpassed by the 1987 crash, the pandemic, and one of the many sharp declines during the Global Financial Crisis. In each of those instances, the S&P 500 continued to experience outsized volatility, but it did bounce notably over the next two weeks. The pandemic was the only “V” bottom among the episodes.”
The biggest question is, “Has the market reached a low or will the sell-off continue?” Based on the futures market Sunday evening it looks like Monday could be another brutal day.
One way to try and determine the answer is to look at chart patterns.
Carter Braxton Worth of Worth Charting published a report on Wednesday last week after the close when the S&P 500 closed at 5,671 that showed how the Index could fall to 4,850, or 14.5% for a total decline of 21.25% from the Index’s high water mark. His first chart is a 10-year weekly bar chart that showed an unfilled gap at 4,842.
On Friday Worth published another report with multiple charts showing a decline to approximately 4,850+/-. This chart compared the current S&P decline if it were to fall to 4,842, down 21.25%, to the Covid low in early 2020 of negative 35.4% and the 2022 bear market decline of 27.55%.
The third chart was a bull market channel from 2022 to 2025 that showed the Index had broken above the upper band and had recently pulled back. The lower channel price was also at 4,842.
The fourth chart shows the peak of the 2021 bull market would intersect the market falling to 4,842 also.
Worth then combined two of the previous charts with an updated S&P 500 price that shows a rising line along with the 2021 bull market high.
He mentioned in his nightly video that even though there are multiple charts showing the S&P 500 falling to 4,842 it is not a certainty that it will. Or that if it does hit that level that it would stop there.
With the fundamental change in trade policy that President Trump is pursuing, it feels like this time is comparable to Global Financial Crisis where the S&P 500 Index lost 56.8% of its value from 1,565.15 on October 9, 2007, to 676.63 on March 9, 2009.
Read the full article here


