


Silver (XAG/USD) declines on Tuesday to around $45.90 per ounce at the time of writing, down 1.80% for the day, after hitting a one-month low at $45.56 earlier in the day. According to TD Securities, the Silver market is entering a normalization phase after a record wave of free-floating metal inflows into London vaults, reducing the need for elevated prices to attract additional supply.
The drop also comes amid softer Indian demand following the Reserve Bank of India (RBI) intervention, which helped curb imports. Daniel Ghali, Senior Commodity Strategist at TDS, notes that the combination of speculative position unwinding and easing physical demand could drive prices down. “Silver can now trade back to $40/oz in precisely the same state of the world, likely catalyzed by an unwind of positions following a climaxing speculative fervor”, noted Ghali.
This consolidation occurs within a broader correction in precious metals, which is amplified by improving trade sentiment between the United States (US) and China, thereby reducing safe-haven demand. However, expectations of further Federal Reserve (Fed) interest rate cuts could, over the medium term, limit the extent of the correction.
Silver Technical Analysis: XAG/USD remains trapped in a bearish channel
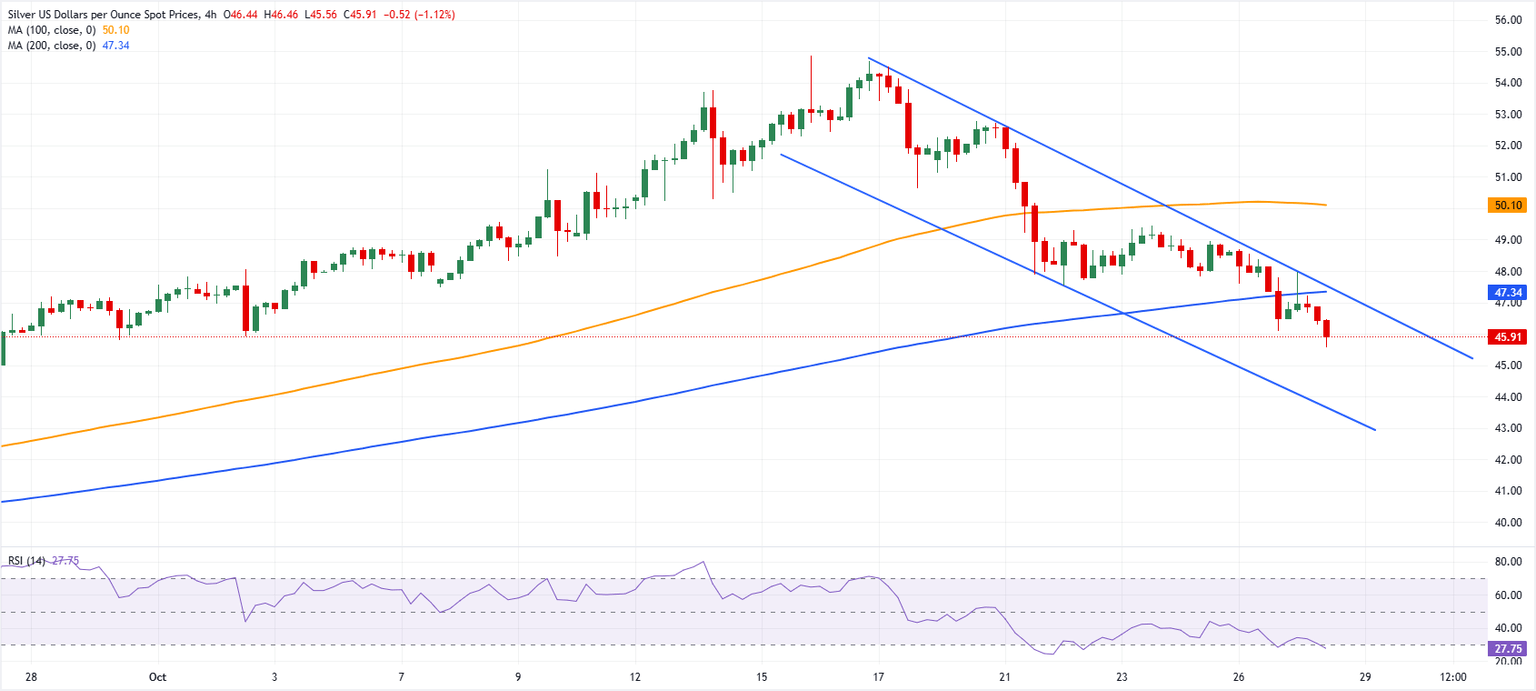
Silver 4-hour chart. Source: FXStreet.
Silver remain under pressure, extending a correction within a downward channel visible on the 4-hour chart that has been in place since the $54.68 peak. The bearish momentum has pushed the metal below both the 100- and 200-period Simple Moving Averages (SMA) on the same timeframe, reinforcing the short-term negative bias.
On the downside, beyond the psychological levels of $45.00 and $44.00, Silver could find support near the lower bound of the descending channel, currently around $43.80. However, the Relative Strength Index (RSI), has now entered oversold territory, below the 30 level, suggesting caution as a potential technical rebound may emerge.
Any attempt to recover would likely face resistance near $47.34, where the 200-period SMA and the upper edge of the channel converge. A break above this area could strengthen the bullish outlook, opening the door for a move toward $48.00 and possibly the 100-period SMA, now located at $50.10.
Read the full article here


