


Silver (XAG/USD) trades with a positive bias for the second straight day on Thursday, though it lacks follow-through buying and remains confined in the previous day’s broader range. The white metal holds above the $84.00 mark during the Asian session, up over 1% for the day.
The near-term bias is mildly bearish as the XAG/USD retreats from last week’s $86 area while holding below the rising 100-period Simple Moving Average (SMA) on the 1-hour chart. The said SMA is pegged near $88 and should now act as overarching dynamic resistance.
The Moving Average Convergence Divergence (MACD) indicator edges back toward the zero line after a prior positive phase. The Relative Strength Index (RSI) is hovering just below 50, reinforcing a consolidative-to-soft downside tone rather than an impulsive selloff.
Initial resistance emerges at the recent intraday highs around $85.00, followed by a stronger cap near $86.20, where prior peaks align with fading upside momentum. A break above the latter would open the way toward the $88.00 region, where the 100-hour SMA is clustered and would be expected to attract renewed selling interest.
On the downside, immediate support sits at $83.50, with a deeper floor at $82.00, close to the latest reaction low and trend-line proximity. A clear drop through $82.00 would expose the $80.95 trend-line break area as the next bearish target, signalling a more decisive shift away from the prevailing medium-term uptrend.
Meanwhile, the upward support trend line from around $64 remains intact, yet the recent pullback toward the low-$80s shows buyers losing immediate control.
(The technical analysis of this story was written with the help of an AI tool.)
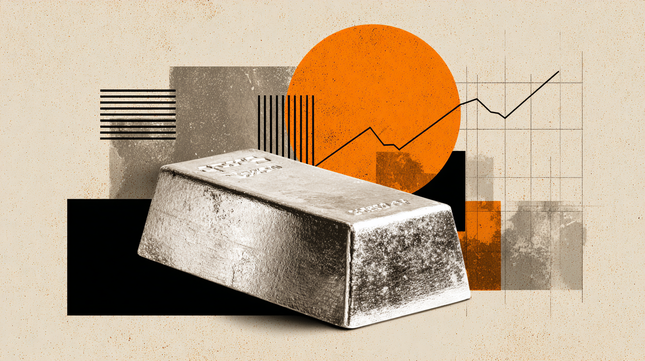
XAG/USD 1-hour chart
Silver FAQs
Silver is a precious metal highly traded among investors. It has been historically used as a store of value and a medium of exchange. Although less popular than Gold, traders may turn to Silver to diversify their investment portfolio, for its intrinsic value or as a potential hedge during high-inflation periods. Investors can buy physical Silver, in coins or in bars, or trade it through vehicles such as Exchange Traded Funds, which track its price on international markets.
Silver prices can move due to a wide range of factors. Geopolitical instability or fears of a deep recession can make Silver price escalate due to its safe-haven status, although to a lesser extent than Gold’s. As a yieldless asset, Silver tends to rise with lower interest rates. Its moves also depend on how the US Dollar (USD) behaves as the asset is priced in dollars (XAG/USD). A strong Dollar tends to keep the price of Silver at bay, whereas a weaker Dollar is likely to propel prices up. Other factors such as investment demand, mining supply – Silver is much more abundant than Gold – and recycling rates can also affect prices.
Silver is widely used in industry, particularly in sectors such as electronics or solar energy, as it has one of the highest electric conductivity of all metals – more than Copper and Gold. A surge in demand can increase prices, while a decline tends to lower them. Dynamics in the US, Chinese and Indian economies can also contribute to price swings: for the US and particularly China, their big industrial sectors use Silver in various processes; in India, consumers’ demand for the precious metal for jewellery also plays a key role in setting prices.
Silver prices tend to follow Gold’s moves. When Gold prices rise, Silver typically follows suit, as their status as safe-haven assets is similar. The Gold/Silver ratio, which shows the number of ounces of Silver needed to equal the value of one ounce of Gold, may help to determine the relative valuation between both metals. Some investors may consider a high ratio as an indicator that Silver is undervalued, or Gold is overvalued. On the contrary, a low ratio might suggest that Gold is undervalued relative to Silver.
Read the full article here


