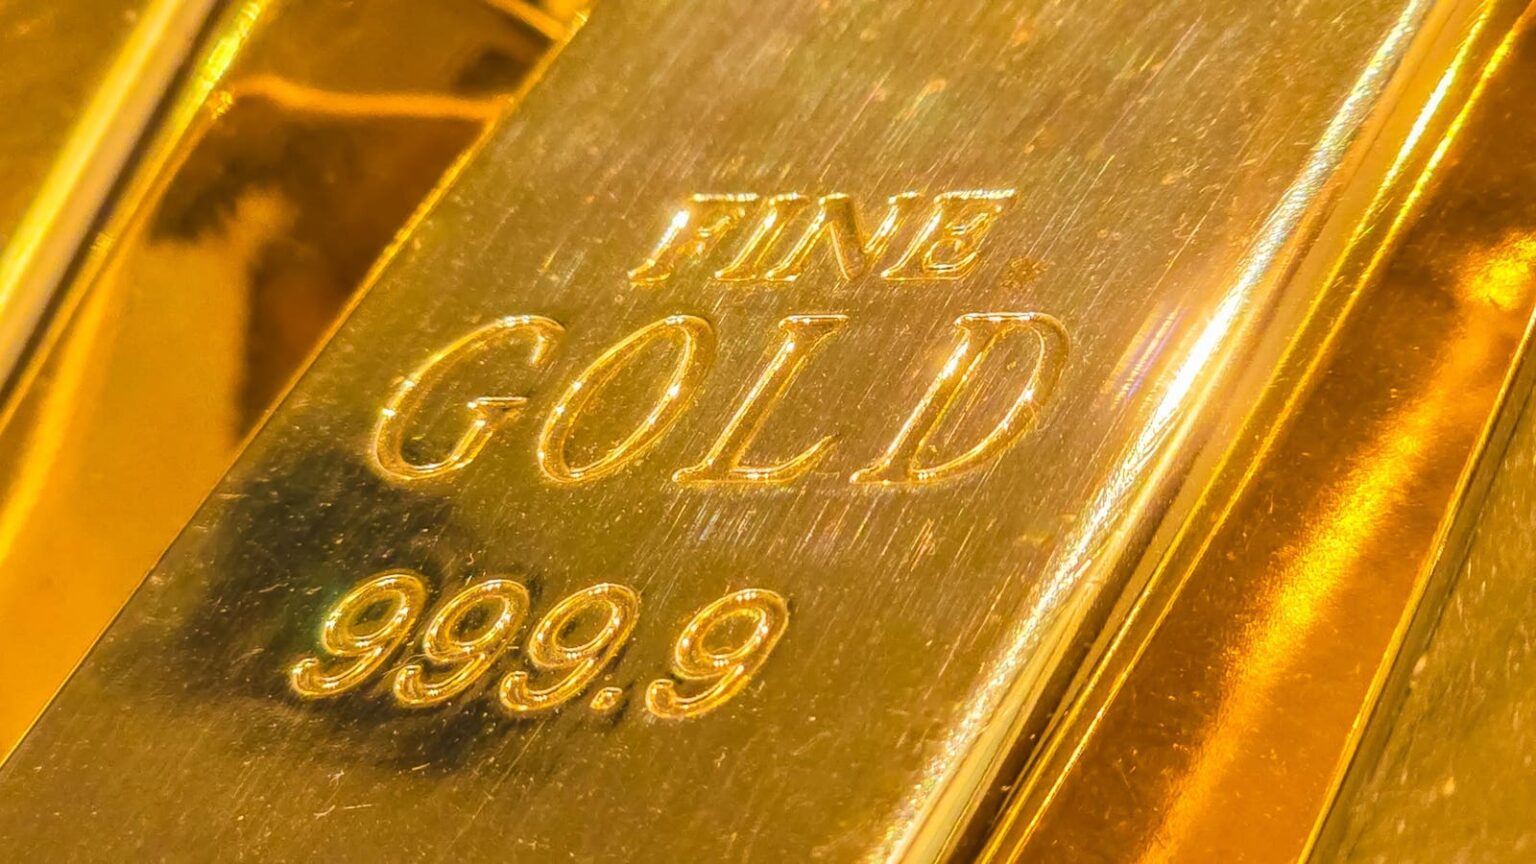
The gold stock ETFs and the silver stock ETFs have dropped from this year’s highs but they’re still up from this time last year. That Costco is now limiting customers to one purchase of a gold bar rather than two is some real background: the expectation remains that tariff-related inflation will lead to higher precious metals prices.
Although President Trump is now telling Walmart to “eat the tariffs,” investors concerned with his on again/off again approach may find uncertainty uncomfortable. That it may be an “intentional negotiating strategy” is subject to debate but gold and silver, the classic inflation hedges, are higher.
Take a look at the daily price chart for the VanEck Vectors Gold Miners ETF, a widely followed indicator of stocks in the sector:
The exchange traded fund holds 63 miners, the largest of which are Newmont and Agnico Eagle. The fund peaked in mid-April at near $63 and last week’s close at near $46 takes the price below the up trending 50-day moving average. Note that the ETF remains much higher than the late December low of just below $34. The 200-day moving average moves steadily upward.
Here’s the daily price chart for the VanEck Vectors Junior Gold Miners ETF:
The fund holds 92 mining stocks with lower market capitalizations. After the April peak near $67, the price last week was down to $58. As with the larger gold miners ETF, it dipped to just below the 50-day moving average and has stayed well above an up trending 200-day moving average.
It’s a similar story with slight differences for the silver mining stocks. The daily price chart for the Global X Silver Miners ETF is here:
The fund holds 40 stocks in the sector, the largest of which are Wheaton Precious Metals, Pan American Silver and Or Royalties. The price topped in mid-April and sold off since then to just below the 50-day moving average. The low on this timeframe came in September, 2024. The 200-day moving average never stops moving higher.
Here’s the daily price chart for the Amplify Junior Silver Miners ETF:
The fund holds 55 small caps in the sector including Coeur Mining, First Majestic Silver and Hecla Mining. This chart has a different look: the peak came in October 2024. Unlike the others, there was no higher high in mid-April. The price last week slid below the 50-day moving average. The 200-day looks more sideways than upward.
Here’s how the dollar chart looks:
The contrast to the gold and silver stocks is apparent: with the dollar, the 50-day moving average in April crossed below the 200-day moving average. The price remains below both measures despite the bounce from the April lows.
If you’re worried about the effect of tariffs on inflation, would you prefer the precious metals stocks or the dollar? Many investors have decided.
More analysis and commentary at johnnavin.substack.com.
Read the full article here


