


Trade Desk (NASDAQ:TTD) – an ad technology player that helps companies buy digital ads across publishers – has seen its stock crash 52% this year. This can primarily be attributed to a downbeat quarterly performance as well as a bleak outlook. In contrast, its peer – AppLovin – posted a solid set of numbers, bolstering its stock price growth. Although APP stock has also taken a hit lately, but for different reasons. But, now that TTD stock has seen a meaningful decline, does it look like a good buy?
We think that TTD stock looks attractive but volatile – making it a tricky pick to buy at its current price of around $56. We believe there is minimal cause for concern with TTD stock, which makes it attractive but highly sensitive to adverse events as its current valuation is extremely high.
We arrive at our conclusion by comparing the current valuation of TTD stock with its operating performance over the recent years as well as its current and historical financial condition. Our analysis of Trade Desk along key parameters of Growth, Profitability, Financial Stability, and Downturn Resilience shows that the company has a very strong operating performance and financial condition, as detailed below. That said, if you seek upside with lower volatility than individual stocks, the Trefis High-Quality portfolio presents an alternative – having outperformed the S&P 500 and generated returns exceeding 91% since its inception.
How Does Trade Desk’s Valuation Look vs. The S&P 500?
Going by what you pay per dollar of sales or profit, TTD stock looks very expensive compared to the broader market.
• Trade Desk has a price-to-sales (P/S) ratio of 14.2 vs. a figure of 3.2 for the S&P 500
• Additionally, the company’s price-to-operating income (P/EBIT) ratio is 81.3 compared to 24.3 for S&P 500
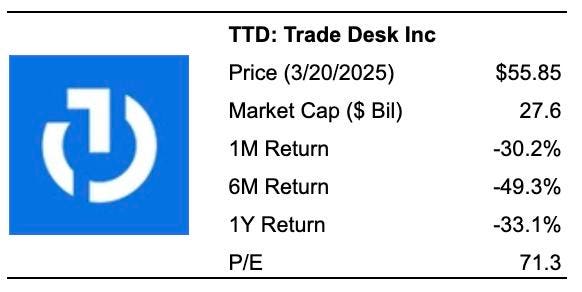
• And, it has a price-to-earnings (P/E) ratio of 47.0 vs. the benchmark’s 24.3
How Have Trade Desk’s Revenues Grown Over Recent Years?
Trade Desk’s Revenues have grown considerably over recent years.
• Trade Desk has seen its top line grow at an average rate of 26.9% over the last 3 years (vs. increase of 6.3% for S&P 500)
• Its revenues have grown 25.6% from $1.9 Bil to $2.4 Bil in the last 12 months (vs. growth of 5.2% for S&P 500)
• Also, its quarterly revenues grew 22.3% to $741 Mil in the most recent quarter from $606 Mil a year ago (vs. 5.0% improvement for S&P 500)
How Profitable Is Trade Desk?
Trade Desk’s profit margins are higher than most companies in the Trefis coverage universe.
• Trade Desk’s Operating Income over the last four quarters was $427 Mil, which represents a moderate Operating Margin of 17.5% (vs. 13.0% for S&P 500)
• Trade Desk’s Operating Cash Flow (OCF) over this period was $739 Mil, pointing to a high OCF-to-Sales Ratio of 30.2% (vs. 15.7% for S&P 500)
Does Trade Desk Look Financially Stable?
Trade Desk’s balance sheet looks very strong.
• Trade Desk’s Debt figure was $312 Mil at the end of the most recent quarter, while its market capitalization is $28 Bil (as of 3/20/2025). This implies a very strong Debt-to-Equity Ratio of 0.9% (vs. 19.0% for S&P 500). [Note: A lower Debt-to-Equity Ratio is desirable]
• Cash (including cash equivalents) makes up $1.9 Bil of the $6.1 Bil in Total Assets for Trade Desk. This yields a very strong Cash-to-Assets Ratio of 31.4% (vs. 14.8% for S&P 500)
How Resilient Is TTD Stock During A Downturn?
TTD stock has seen an impact that was slightly better than the benchmark S&P 500 index during some of the recent downturns. While investors have their fingers crossed for a soft landing by the U.S. economy, how bad can things get if there is another recession? Our dashboard How Low Can Stocks Go During A Market Crash captures how key stocks fared during and after the last six market crashes.
Inflation Shock (2022)
• TTD stock fell 55.7% from a high of $90.11 on 3 January 2022 to $39.89 on 9 November 2022, vs. a peak-to-trough decline of 25.4% for the S&P 500
• The stock fully recovered to its pre-Crisis peak by 17 July 2023
• Since then, the stock has increased to a high of $139.51 on 4 December 2024 and currently trades at around $56
COVID-19 Pandemic (2020)
• TTD stock fell 54.2% from a high of $31.54 on 19 February 2020 to $14.44 on 18 March 2020, vs. a peak-to-trough decline of 33.9% for the S&P 500
• The stock fully recovered to its pre-Crisis peak by 7 May 2020
Putting All The Pieces Together: What It Means For TTD Stock
In summary, Trade Desk’s performance across the parameters detailed above are as follows:
• Growth: Extremely Strong
• Profitability: Strong
• Financial Stability: Extremely Strong
• Downturn Resilience: Neutral
• Overall: Very Strong
Hence, despite its high valuation vis-à-vis the S&P 500, the stock appears attractive but volatile, which supports our conclusion that TTD is a tricky stock to buy.
Not too happy about the volatile nature of TTD stock? The Trefis High Quality (HQ) Portfolio, with a collection of 30 stocks, has a track record of comfortably outperforming the S&P 500 over the last 4-year period. Why is that? As a group, HQ Portfolio stocks provided better returns with less risk versus the benchmark index; less of a roller-coaster ride as evident in HQ Portfolio performance metrics.
Invest with Trefis
Market Beating Portfolios | Rules-Based Wealth
Read the full article here


