


FedEx (NYSE:FDX) is set to report its earnings on Thursday, March 20, 2025. Analysts predict the parcel delivery company will report earnings of $4.63 per share, a rise from $3.86 in the same quarter last year. Revenue is expected to reach $21.89 billion, a modest 1% increase. However, the company faces headwinds from reduced consumer demand and industrial slowdown.
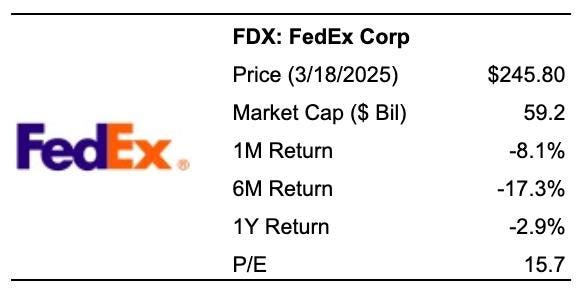
FDX has $59 Bil in current market capitalization. Revenue over the last twelve months was $87 Bil, and it was operationally profitable with $5.9 Bil in operating profits and net income of $3.9 Bil. While the post-earnings stock reaction will depend on how the results and outlook stack up against investor expectations, a detailed look at historical results can aid you if you are an event-driven trader.
Here is how: either understand the historical odds and position yourself prior to the earnings announcement, or look at the correlation between immediate and medium-term returns post earnings and enter a trade one day after the announcement. That said, if you seek upside with lower volatility than individual stocks, the Trefis High-Quality portfolio presents an alternative – having outperformed the S&P 500 and generated returns exceeding 91% since its inception.
See earnings reaction history of all stocks
FedEx’s Historical Odds Of Positive Post-Earnings Return
Some observations on one-day (1D) post-earnings returns:
- There are 19 earnings data points recorded over the last five years, with 10 positive and 9 negative one-day (1D) returns observed. In summary, positive 1D returns were seen about 53% of the time.
- Notably, this percentage increases to 55% if we consider data for the last 3 years instead of 5.
- Median of the 10 positive returns = 6.6%, and median of the 9 negative returns =-4.0%
Additional data for observed 5-Day (5D), and 21-Day (21D) returns post earnings are summarized along with the statistics in the table below.
Correlation Between 1D, 5D, and 21D Historical Returns
A relatively less risky strategy (though not useful if the correlation is low) is to understand the correlation between short-term and medium-term returns post earnings, find a pair that has the highest correlation, and execute the appropriate trade. For example, if 1D and 5D show the highest correlation, a trader can position themselves “long” for the next 5 days if 1D post-earnings return is positive. Here is some correlation data based on 5-year and 3-year (more recent) history. Note that the correlation 1D_5D refers to the correlation between 1D post-earnings returns and subsequent 5D returns.
Learn more about Trefis RV strategy that has outperformed its all-cap stocks benchmark (combination of all 3, the S&P 500, S&P mid-cap, and Russell 2000), to produce strong returns for investors. Separately, if you want upside with a smoother ride than an individual stock like FedEx, consider the High Quality portfolio, which has outperformed the S&P, and clocked >91% returns since inception.
Invest with Trefis
Market Beating Portfolios | Rules-Based Wealth
Read the full article here


