


The Euro (EUR) is treading water against the US Dollar (USD) on Monday, as investors stay cautious ahead of this week’s twin central bank decisions from the Federal Reserve (Fed) and the European Central Bank (ECB).
At the time of writing, EUR/USD is hovering around 1.1639 during the American trading hours, while the US Dollar Index (DXY), which tracks the Greenback’s performance against six major peers, is trading under mild pressure near 98.88.
Traders are positioning defensively as they await policy clues from both sides of the Atlantic. The Fed begins its two-day Federal Open Market Committee (FOMC) meeting on Tuesday, with markets almost certain the central bank will deliver another 25-basis-point (bps) interest rate cut this week, following September’s so-called “risk-management” move. Expectations for further easing strengthened after softer-than-expected US inflation data last week.
According to the CME FedWatch Tool, traders now assign a 96.7% probability of a quarter-point rate cut at the October 29-30 meeting, as officials respond to cooling inflation data and signs of a softening labor market, even though price pressure remains above the Fed’s 2% target.
In contrast, the ECB is widely expected to keep its benchmark rate unchanged at 2.00% for a third consecutive meeting, as policymakers assess recent signs of improvement in Eurozone business activity and stabilizing inflation. Eurozone inflation remains broadly stable around the ECB’s 2% target, reinforcing expectations that the central bank will leave rates unchanged on Thursday.
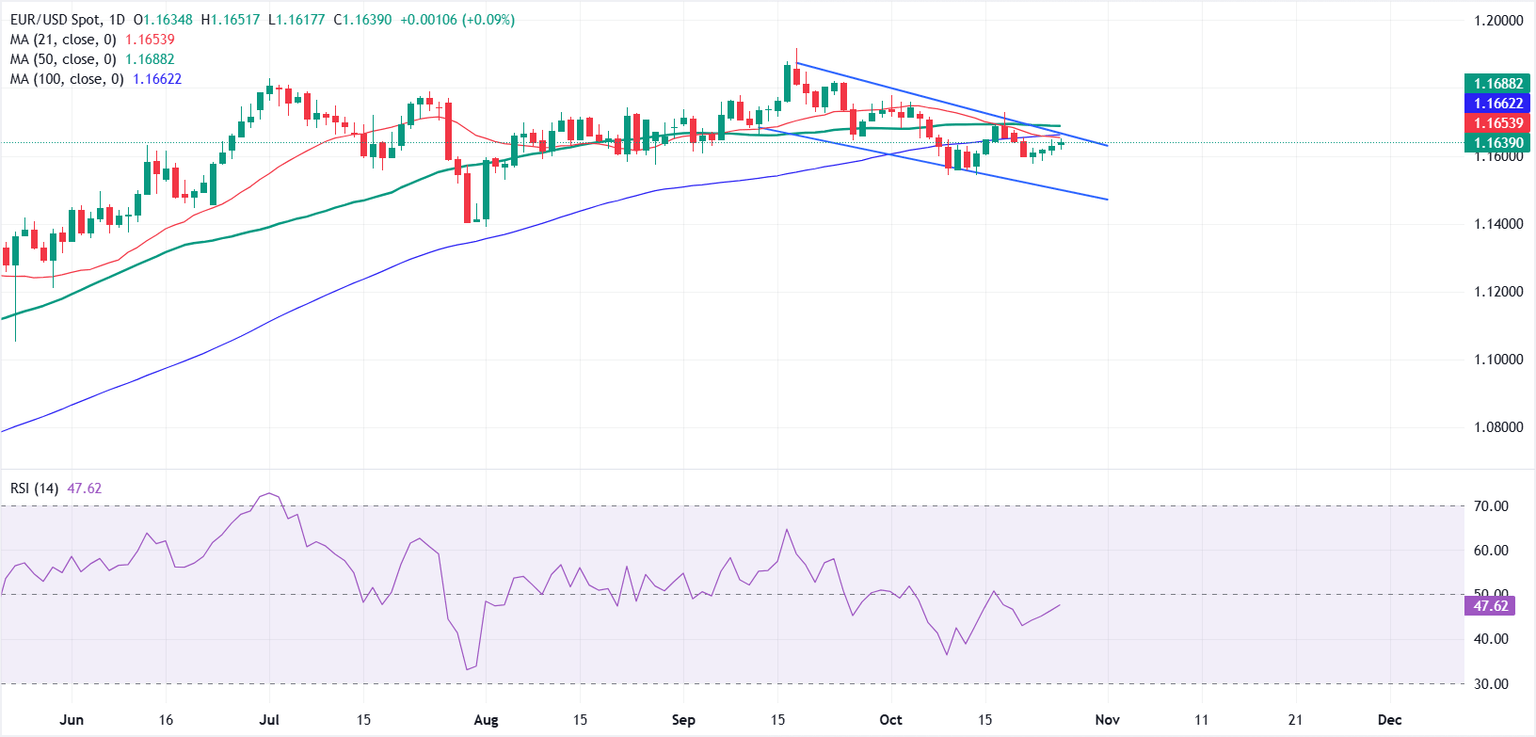
From a technical perspective, EUR/USD remains confined within a descending channel, with price action subdued ahead of Fed and ECB interest rate decisions this week. The pair trades below key moving averages, as the 21, 50 and 100-day Simple Moving Averages (SMAs) cluster between 1.1650 and 1.1690, forming a strong resistance zone.
On the downside, support sits near 1.1600, followed by 1.1550, while the Relative Strength Index (RSI) sits at 47, signaling limited upside momentum. A sustained move above the 50-day SMA near 1.1690 would be needed to shift the short-term bias in favor of the bulls.
US Dollar Price Today
The table below shows the percentage change of US Dollar (USD) against listed major currencies today. US Dollar was the strongest against the Japanese Yen.
| USD | EUR | GBP | JPY | CAD | AUD | NZD | CHF | |
|---|---|---|---|---|---|---|---|---|
| USD | -0.07% | -0.17% | 0.11% | 0.00% | -0.64% | -0.26% | 0.02% | |
| EUR | 0.07% | -0.07% | 0.20% | 0.08% | -0.54% | -0.19% | 0.14% | |
| GBP | 0.17% | 0.07% | 0.27% | 0.16% | -0.47% | -0.12% | 0.20% | |
| JPY | -0.11% | -0.20% | -0.27% | -0.11% | -0.76% | -0.36% | -0.07% | |
| CAD | -0.00% | -0.08% | -0.16% | 0.11% | -0.64% | -0.26% | 0.06% | |
| AUD | 0.64% | 0.54% | 0.47% | 0.76% | 0.64% | 0.36% | 0.68% | |
| NZD | 0.26% | 0.19% | 0.12% | 0.36% | 0.26% | -0.36% | 0.30% | |
| CHF | -0.02% | -0.14% | -0.20% | 0.07% | -0.06% | -0.68% | -0.30% |
The heat map shows percentage changes of major currencies against each other. The base currency is picked from the left column, while the quote currency is picked from the top row. For example, if you pick the US Dollar from the left column and move along the horizontal line to the Japanese Yen, the percentage change displayed in the box will represent USD (base)/JPY (quote).
Read the full article here


